Dashboard
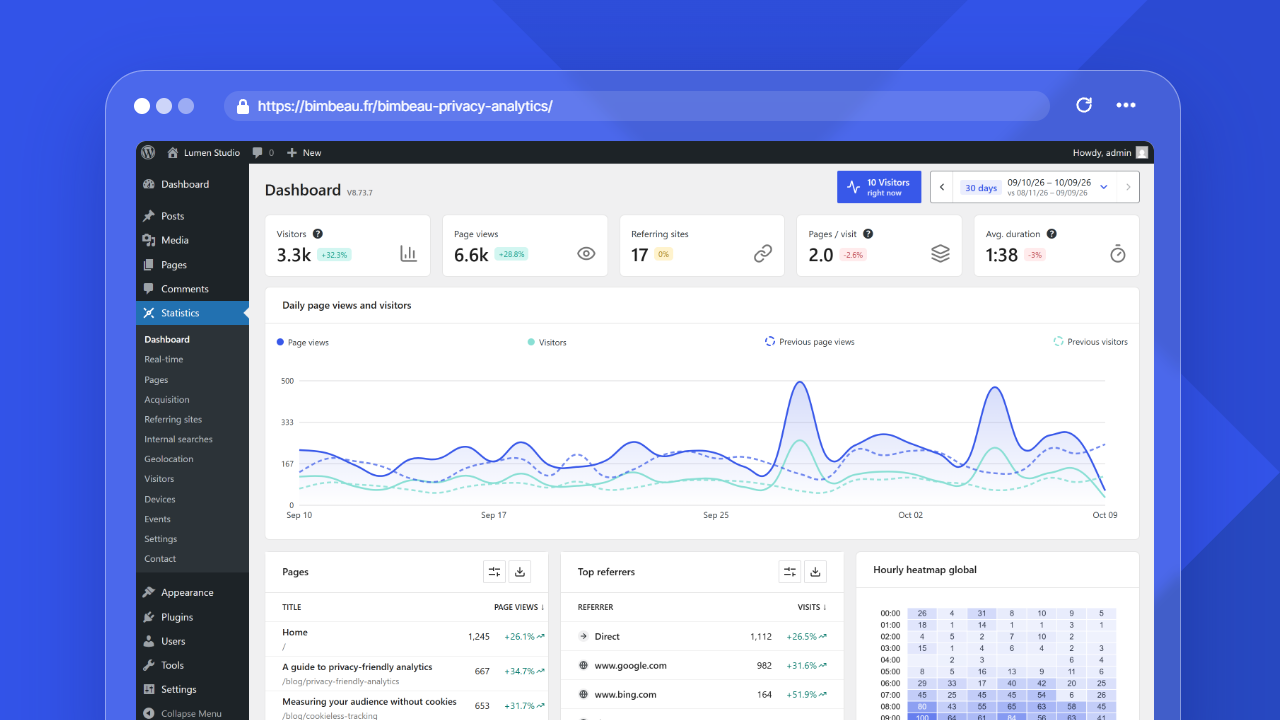
The BimBeau Privacy Analytics dashboard gives you a quick overview of your website traffic from inside the WordPress admin area.
Use it to understand how your site is performing, identify traffic trends, and quickly access the main analytics reports.
Good to know
The dashboard focuses on practical website analytics for site owners. It is not intended to expose technical tracking or database details.
Open the dashboard
In your WordPress admin area, go to Statistics → Dashboard.
The dashboard is the main entry point for BimBeau Privacy Analytics reports.
What you can monitor
The dashboard can help you answer questions such as:
- How many visitors and page views did my website receive?
- How do these figures compare with the previous period?
- Which pages are attracting the most attention?
- Which websites send visitors to my site?
- At which days and hours is my site the most visited?
Key figures
The top of the dashboard shows one card per key figure for the selected period. Each card shows the change compared with the previous period of the same length, as a percentage, when that period has data.
| Card | What it means |
|---|---|
| Visitors | The number of bounded visitor activity rows detected during the selected period, humans only. When robots were detected in the period, the help icon says how many were excluded |
| Page views | The total number of tracked page views during the selected period |
| Referring sites | The number of different referring sites that sent visits during the selected period |
| Pages / visit | The average number of page views per visit |
| Avg. duration | The average active time spent during a visit, when timing data is available |
| Real-time | The number of visitors active right now. This card is shown on small screens only |
Each card is a link: select it to open the matching report (Visitors and Pages / visit open Visitors, Page views and Avg. duration open Pages, Referring sites opens Referring sites, Real-time opens Real-time). A card is hidden when its report is disabled in the settings: Page views and Avg. duration need the Pages report, Referring sites needs the Referring sites report, Pages / visit needs the Visitors report, and Real-time needs the Real-time report.
Good to know
Average duration measures active foreground engagement. It should not be interpreted as the full wall-clock duration of a browser session.
Daily page views and visitors
Under the key figures, the Daily page views and visitors chart shows the page views and the visitors of each day of the selected period. The same values for the previous period are drawn as a lighter overlay, so you can compare the two periods day by day. When the selected period is a single day, the chart shows hourly values.
Hover or focus a point to see the date and the current and previous values.
Date range
Use the date range controls to change the reporting period.
A shorter period is useful for checking recent activity. A longer period is better for identifying trends over time.
Common ways to use date ranges:
- today or recent days for quick monitoring;
- the last 7 or 30 days for short-term performance;
- longer ranges for trend analysis and historical comparison.
Pages
The Pages card lists your most viewed pages with their page views and the trend compared with the previous period. It is shown when the Pages report is enabled.
The compact Pages widget can display page titles, URLs, or both: choose the URL and Title columns in View options → Columns (the choice is shared with the lists of the Pages report). Labels longer than 50 characters are shortened visually so that the page-view column remains available; the complete label remains available to assistive technology and page navigation. The full Pages report keeps complete labels and is not subject to this fixed display limit.
Use this card to identify:
- pages that attract the most traffic;
- content that performs well;
- important pages that may deserve further optimization;
- unexpected traffic spikes.
For a deeper view, open the Pages report.
Top referrers
The Top referrers card lists the sites that send the most visits, with their visits and the trend compared with the previous period. Direct traffic appears as Direct. The card is shown when the Referring sites report is enabled.
For more detail, open the Referring sites report, or the Acquisition report for traffic channels.
The Top referrers table displays complete domains up to 50 characters and shortens longer values with an ellipsis. The complete value remains available on hover or keyboard focus. When referrer favicons are enabled in General settings, a compact loader occupies the icon slot while the server resolves and stores an icon locally. The table falls back to the generic icon when an icon is unavailable. Direct traffic keeps its dedicated icon.
Hourly heatmap
The Hourly heatmap global card shows the page views of the selected period by day of the week and hour of the day. The more intense the color of a cell, the more page views it had. It needs hourly aggregated data; when that data is not available, the card says so.
Real-time activity
The dashboard does not include a real-time section. Two shortcuts show the number of visitors active right now:
- the button in the header of every report screen, which shows the number of active visitors and opens the Real-time report;
- the Real-time key figure card, shown on small screens only.
Both are available when advanced statistics and the Real-time report are enabled.
Good to know
Real-time activity depends on recent traffic. Low-traffic websites may show no active visitors until someone browses the site.
WordPress dashboard widget
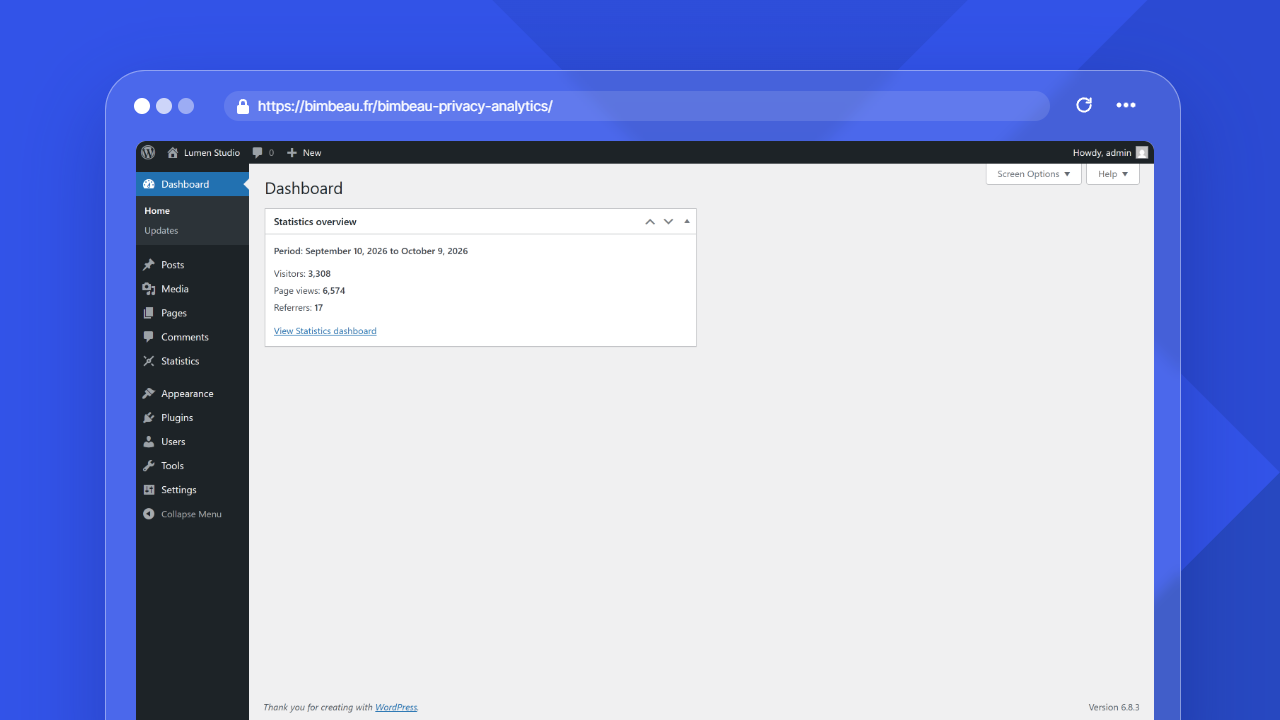
BimBeau Privacy Analytics also adds a Statistics overview widget to the main WordPress dashboard (Dashboard → Home). Users who can open the plugin dashboard see it.
The widget shows:
- the period: the last 30 days including today, with dates in the site date format;
- Visitors, the same human visitors as the dashboard Visitors card (Visits is shown instead when the visitor count is not available);
- Robots excluded, when robots were detected in the period;
- Page views;
- Referrers, the number of different referring sites;
- a View Statistics dashboard link that opens the plugin dashboard.
Each figure follows the report it belongs to: visitor figures are hidden when the Visitors report is disabled, page views when the Pages report is disabled, and referrers when the Referring sites report is disabled. When all three are disabled, the widget asks you to enable at least one analytics panel. When no data is available, the widget says so and still shows the link to the dashboard.
You can hide the widget like any other one with Screen Options at the top of the WordPress dashboard.
Empty dashboard states
If the dashboard is empty after installation, this usually means BimBeau Privacy Analytics has not collected enough activity yet.
Try the following checks:
-
Visit a public page
Open a public page of your website in a browser.
-
Refresh the dashboard
Return to Statistics → Dashboard and refresh the report.
-
Check privacy and tracking settings
Make sure tracking is enabled and that your settings do not exclude the current user role or browsing context.
-
Check consent behavior
If advanced tracking is controlled by a CMP, confirm that your consent setup is not blocking the behavior you expect to test.
Free and Pro behavior
The main dashboard is available in BimBeau Privacy Analytics Free and BimBeau Privacy Analytics Pro.
Free users can use the core dashboard to monitor essential aggregate analytics such as visitors, page views, referring sites, top pages, and the hourly heatmap.
Pro users can access the same dashboard foundation, plus Pro-only workflows such as exports, Page Details, event analytics, and app-related features when licensed features are active.
Next step
Continue with Pages to understand which pages receive the most traffic.