Devices
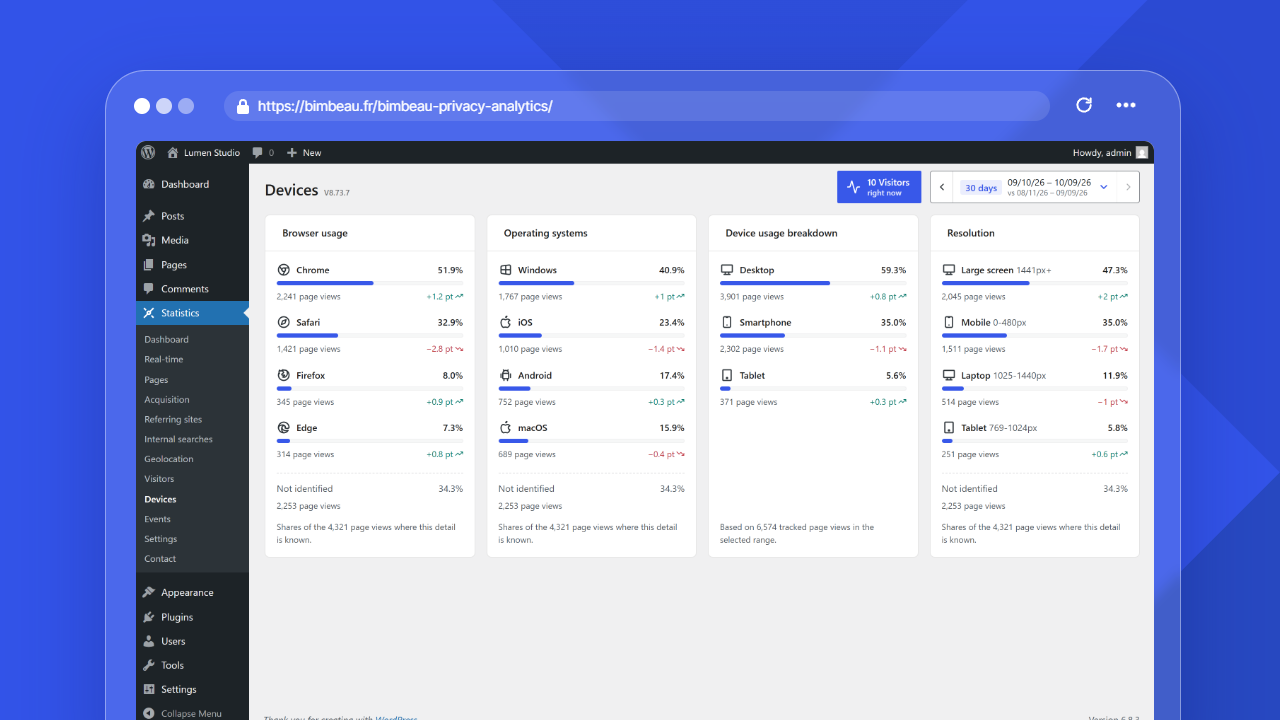
The Devices report helps you understand which types of devices visitors use when browsing your WordPress website.
Use this report to evaluate the balance between desktop, mobile, and tablet traffic, then make better design, content, and performance decisions.
Good to know
Device reporting is available in BimBeau Privacy Analytics Free and BimBeau Privacy Analytics Pro.
Open the Devices report
In your WordPress admin area, go to Statistics → Devices.
Good to know
The Devices report depends on advanced statistics. When Enable advanced stats after consent is turned off in the Tracking and privacy settings, the Devices report is hidden from the Statistics menu.
What this report helps you understand
Use Devices to answer questions such as:
- Do most visitors browse my site on desktop or mobile?
- Should I prioritize mobile layout improvements?
- Is tablet traffic meaningful for my audience?
- Are device patterns changing over time?
Device categories
BimBeau Privacy Analytics groups traffic into practical device categories.
| Category | What it usually means |
|---|---|
| Desktop | Visitors browsing from a desktop or laptop computer |
| Smartphone | Visitors browsing from a smartphone or similar mobile device (the "mobile" device class) |
| Tablet | Visitors browsing from a tablet device |
Bots are not one of these categories. Bot detection checks the browser identification (User-Agent) of every tracked page, including crawlers that run JavaScript, such as search engine rendering or SEO audit tools. Bot traffic is kept out of page views, visits, entry pages, acquisition and visitor totals. The Device usage breakdown card can show it on request with the Include robots switch (see Bots and automated traffic).
Important
Device detection is based on technical signals available in the request or browser context. It is useful for trends, but it should not be treated as a perfect device fingerprinting system.
Main panels
The Devices report uses audience breakdown cards instead of one table. The visible cards may include:
| Card | What it shows |
|---|---|
| Browser usage | Browsers detected for tracked page views in the selected range |
| Most used operating systems | Operating systems detected for tracked page views in the selected range |
| Device usage breakdown | Device categories detected for tracked page views in the selected range |
| Resolution | Screen or viewport resolution buckets detected for tracked page views in the selected range |
Each card lists detected labels, page-view counts, and the relative share for the selected range.
The breakdowns count the page views of every visitor of the selected range, and the summary under each card gives that total, for example "Based on 12,345 tracked page views in the selected range." Visitors whose detail is unknown (for example visits measured without advanced statistics have no browser or resolution) count in that total but not in the shares of that card.
How to interpret device data
Device data is most useful when it informs design and content decisions.
For example:
- high mobile traffic means mobile layout, speed, readability, and tap targets are especially important;
- high desktop traffic may indicate research, B2B, editorial, or work-context usage;
- tablet traffic may matter for visual, retail, education, or browsing-heavy websites.
Mobile vs desktop decisions
Prioritize fast loading, short headings, readable typography, clear buttons, simple forms, and content that works well on small screens.
Review larger layouts, comparison pages, long-form content, dashboards, tables, and conversion paths that may be used in a work or research context.
Bots and automated traffic
Crawlers, monitoring tools, scanners, and automated agents request pages on most websites. BimBeau Privacy Analytics detects them and keeps them out of the Devices report by default, so the device categories describe human visitors only.
To compare them with human traffic, turn on Include robots in the header of the Device usage breakdown card. The card then adds a Bot row, last, with the page views of the robots of the selected range, and recomputes every share over human and robot page views. The robot page views are those of every robot of the range listed in the Robots tab of the Visitors report; the line under the card gives their page views and the number of robots. The switch only changes this card: browsers, operating systems, resolutions and every other report stay human-only. It is off each time the screen opens.
Good to know
Bot activity is not always harmful: search engines and legitimate tools crawl websites regularly. A large Bot share shows how much of the raw traffic your statistics already filter out; it does not change the other figures.
Date range
Use the date range controls to review device patterns over different periods.
Short ranges are useful after a campaign, redesign, or performance optimization. Longer ranges help you understand whether your audience is consistently mobile-first, desktop-first, or mixed.
Practical use cases
Device reports can support decisions such as:
- testing important pages on the most common device type;
- improving mobile navigation;
- simplifying forms on small screens;
- prioritizing responsive design fixes;
- checking whether a campaign attracts a different device mix.
Free and Pro behavior
BimBeau Privacy Analytics Free includes the Devices report for aggregate device-category analysis.
BimBeau Privacy Analytics Pro uses the same Devices report. The Devices report has no export.
Empty or unexpected results
If the Devices report is empty or does not show the data you expect, check the following:
-
Check the selected date range
Device activity may exist outside the current reporting period.
-
Generate a test visit
Open a public page from a desktop or mobile device, then refresh the report after a short moment.
-
Review tracking settings
Make sure your current role, privacy settings, consent setup, or exclusion rules are not preventing activity from being recorded.
-
Compare with other reports
Check the Dashboard, Pages, or Real-time reports to confirm whether BimBeau Privacy Analytics is recording traffic generally.
Next step
Continue with Geolocation to understand where visits come from geographically.